Services
Data Visualization Services
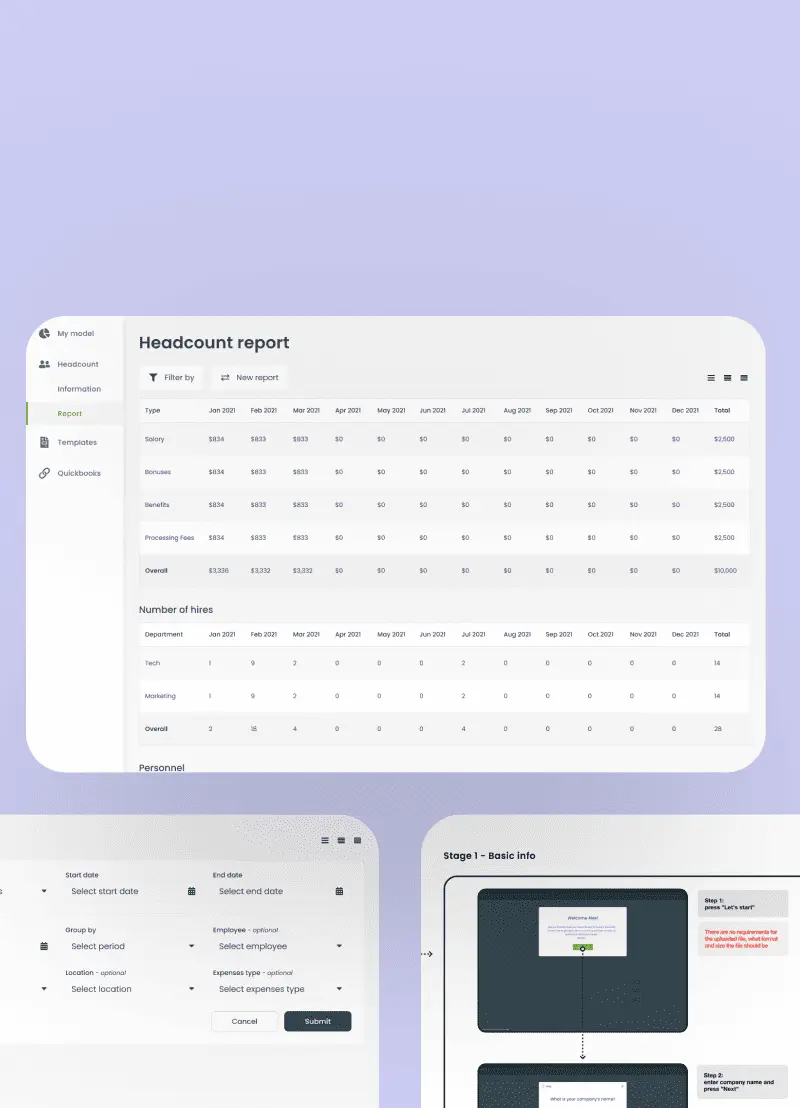
Digicode offers top-quality data visualization consulting services to help medium businesses and large enterprises transform data into actionable business intelligence. Our custom visualization solutions can help you identify trends, visualize patterns, and better understand your business data. Contact us to unlock the full potential of your data!


Data Visualization Services
We Offer for Businesses
Artificial
Intelligence and
Machine Learning
As a data visualization consulting company, Digicode leverages AI & ML to analyze large volumes of data, identify patterns and trends, and generate meaningful visualizations that are easy to understand.
Real-Time
Visualization and
Analysis
Digicode helps businesses to create custom intuitive dashboards to make informed decisions based on up-to-date information and respond quickly to changes in the market.
Data Storytelling
Using industry-lead data visualization techniques, Digicode can help businesses to convey complex data simply and engagingly, making it easier for stakeholders to understand and act upon the insights.
Virtual and
Augmented Reality
Digicode’s virtual and augmented reality (VR/AR) data visualization consultant services allow businesses to visualize their data in immersive 3D environments, gaining insights that would be difficult to obtain using traditional visualization tools.
Interactive
Visualization
Digicode’s interactive data visualization service enables enterprises to explore their data in a more intuitive and user-friendly way, making it easier to identify trends, patterns, and insights.
Mobile-Friendly
Data
By creating mobile-friendly visualizations, Digicode can build business data visualization with cloud service to monitor business data from anywhere, anytime, using their mobile devices.
Predictive
Analysis
With data visualization as a service, businesses can forecast future trends and conduct in-depth research based on historical data to make informed decisions and identify new growth opportunities.
Our Data Visualization Process
At Digicode, we follow proven data visualization techniques to ensure that we deliver high-quality custom visualization solutions for monitoring goals and results, identifying opportunities, predicting demand, and other specific needs of our clients. Our data visualization services include the following stages:
Define the problem
The first step in our data visualization process is to define the problem we are trying to solve. We work closely with our clients to understand their specific data visualization needs and identify the goals they want to achieve. By defining the problem, we can ensure that we create a visualization solution that is tailored to the client’s unique needs
Collect Data
The second step in the business data visualization process is collecting the relevant data. We work closely with our clients to understand their business needs and identify the data sources to provide the necessary information. It can include data from internal databases, public datasets, or third-party APIs.
Analyze the data
Once we have collected the data, we clean it and prepare it for analysis. Data analysis is critical to ensuring the data is accurate and ready for analysis. In addition, our data visualization consulting team uses advanced tools and techniques to identify and correct any errors or inconsistencies in the data.
Choose a Visualization Type
After the data has been cleaned and prepared, we select the most appropriate chart type to communicate the insights hidden within the data effectively. As a data visualization consulting company, we consider the nature of the data, the audience, and the purpose of the visualization to select a chart type that will effectively communicate the information.
Prepare Data
In this step, we prepare the data for visualization. It involves formatting the data, selecting the appropriate axes, and deciding the best way to present it. Our data visualization consultant team works closely with you to ensure that the data is prepared to meet your needs and requirements.
Visualize the Data
Finally, we use advanced data visualization techniques and tools to visualize the filtered dashboards that convey complex data in an interactive and easy-to-read format.
Are you struggling to make sense of your data? Our data visualization consulting service can help you gain valuable insights and make informed decisions.
Our services have been helping businesses with amazing success stories
$ 300M+
50+
250+
Technologies and Tools We Use
At Digicode, we leverage the most advanced data visualization technologies and tools to create stunning data visualizations that help businesses boost sales and support marketing performance.

Industries
As a leading data visualization service provider, Digicode works with various industries, providing tailored custom visualization solutions that help businesses optimize their processes and gain valuable insights.
Retail
Retail businesses can benefit significantly from business data visualization. For example, retailers can optimize pricing, inventory management, and marketing campaigns by analyzing customer buying patterns and preferences. We provide solutions to help retailers make sense of their data and make informed decisions that improve their bottom line.
Manufacturing
Manufacturing companies use data visualization as a service to optimize production processes, predict maintenance needs, and improve product quality. Our team of experts provides customized data visualization solutions that help manufacturers increase efficiency and reduce costs.
Agriculture
The agriculture industry can benefit from modern surveillance, analysis, and prediction methods to survey crops, fields, and more. We create custom intuitive dashboards that help agricultural businesses make data-driven decisions that increase yields and reduce costs.
Supply Chain
Supply chain data solutions include predicting demand, inventory management, risk management, and transportation optimization.
Transportation
Transportation companies use interactive dashboards to optimize routes, reduce fuel consumption, and improve safety.
MarTech
Data visualization is critical for analyzing customer behavior, tracking marketing campaign performance, monitoring goals and results, and identifying opportunities.
Financial Services
Financial companies transform data into actionable business intelligence to detect fraud, reduce risk, and optimize investment portfolios.
Healthcare
Data visualization is essential in healthcare to analyze patient data, improve patient outcomes, track disease outbreaks, and manage medical resources.
Government Agencies
With data visualization services, government agencies analyze demographic data, transportation patterns, crime rates, and other data types to improve public services, policy-making, and emergency response.
Advantages of Using Data Visualization for Your Business
-
Better Decision Making.
Business data visualization makes it easier for decision-makers to understand complex information, identify trends and patterns, and make informed decisions based on data. -
Improved Data Analysis.
It enables businesses to rapidly and effectively analyze and interpret vast amounts of data, revealing crucial insights and trends that may be challenging to identify from raw data. -
Increased Efficiency.
Businesses can save time and resources formerly needed for manual analysis and report preparation by automating data analysis and reporting processes. -
Enhanced Collaboration.
Data visualization consulting services encourage cooperation and knowledge sharing throughout organization departments in the report, allowing them to cooperate more successfully and exchange insights and data in real-time.
Our Clients and Partners





Why Digicode is the Optimal Choice for Data Visualization as a Service
-
Unmatched expertise in various cloud platforms, open-source technologies, and the full data technology stack for comprehensive data analysis and visualization
-
Extensive certification across leading data engineering tech stacks such as GCP and Microsoft, ensuring that Digicode’s data visualization consulting services are based on the latest industry standards and practices
-
Industry-specific custom visualization solutions are designed to cater to the unique needs of enterprises, enabling to make data-driven decisions
-
Utilization of influential technologies such as AI and ML, guaranteeing insightful and accurate data visualization
-
Adherence to the best industry practices to ensure your data is secure, including NDA, secure device policies, and role-based access permission
What Our Clients Say


Michael Kadisha
Founder + CEO at Treedom

Dr Oren Elisha
Principal scientist and AI group manager at Microsoft
Niva Gubergrit
Product Manager
Hila Yehuda
Principal at Microsoft
Marc Degen
Co-Founder, Modum AG
Frédéric Chenevard
CEO, We Are Owners SA
Aleksandar Milosevic
Inventor bopy
James Zhao
Co-Founder and Product Developer, Thought & Function
Case Studies
Related Blogs
#Staff Augmentation
Ultimate Guide for Choosing the Right Technology Modernization Partner

Elkhan Shabanov
December 18, 2024

Philip Lafazanov
May 16, 2023

Philip Lafazanov
May 16, 2023
FAQ
-
What are data visualization services?
Data visualization services refer to the use of software tools and techniques to represent data in a visually appealing and informative way. This can include creating charts, graphs, maps, and other interactive displays that help businesses make sense of their data.
-
What is the main reason for utilizing data visualization?
The main reason for utilizing business data visualization is to gain insights from data that might otherwise be difficult to understand. By creating interactive and easy-to-read data representations, businesses can quickly identify patterns, trends, and outliers, enabling them to make data-driven decisions.
-
What are data visualization consulting services?
Data visualization consulting services offer expert advice and support to businesses looking to implement or improve their BI & data visualization capabilities. These services can include everything from choosing the right tools and software to creating custom visualization solutions that meet the specific needs of your business.
-
How can data visualization services help my business?
Data visualization service can help your enterprise by providing you with a clearer understanding of your data, enabling you to identify areas for improvement, make more informed decisions, and ultimately drive business growth. By visualizing your data, you can quickly spot patterns and trends that might otherwise go unnoticed, allowing you to take action to optimize your operations and increase efficiency.
